Dapper
Where tech and public affairs meet: Usability-Driven Innovation in Data-Heavy Government Tools.
About the
Project
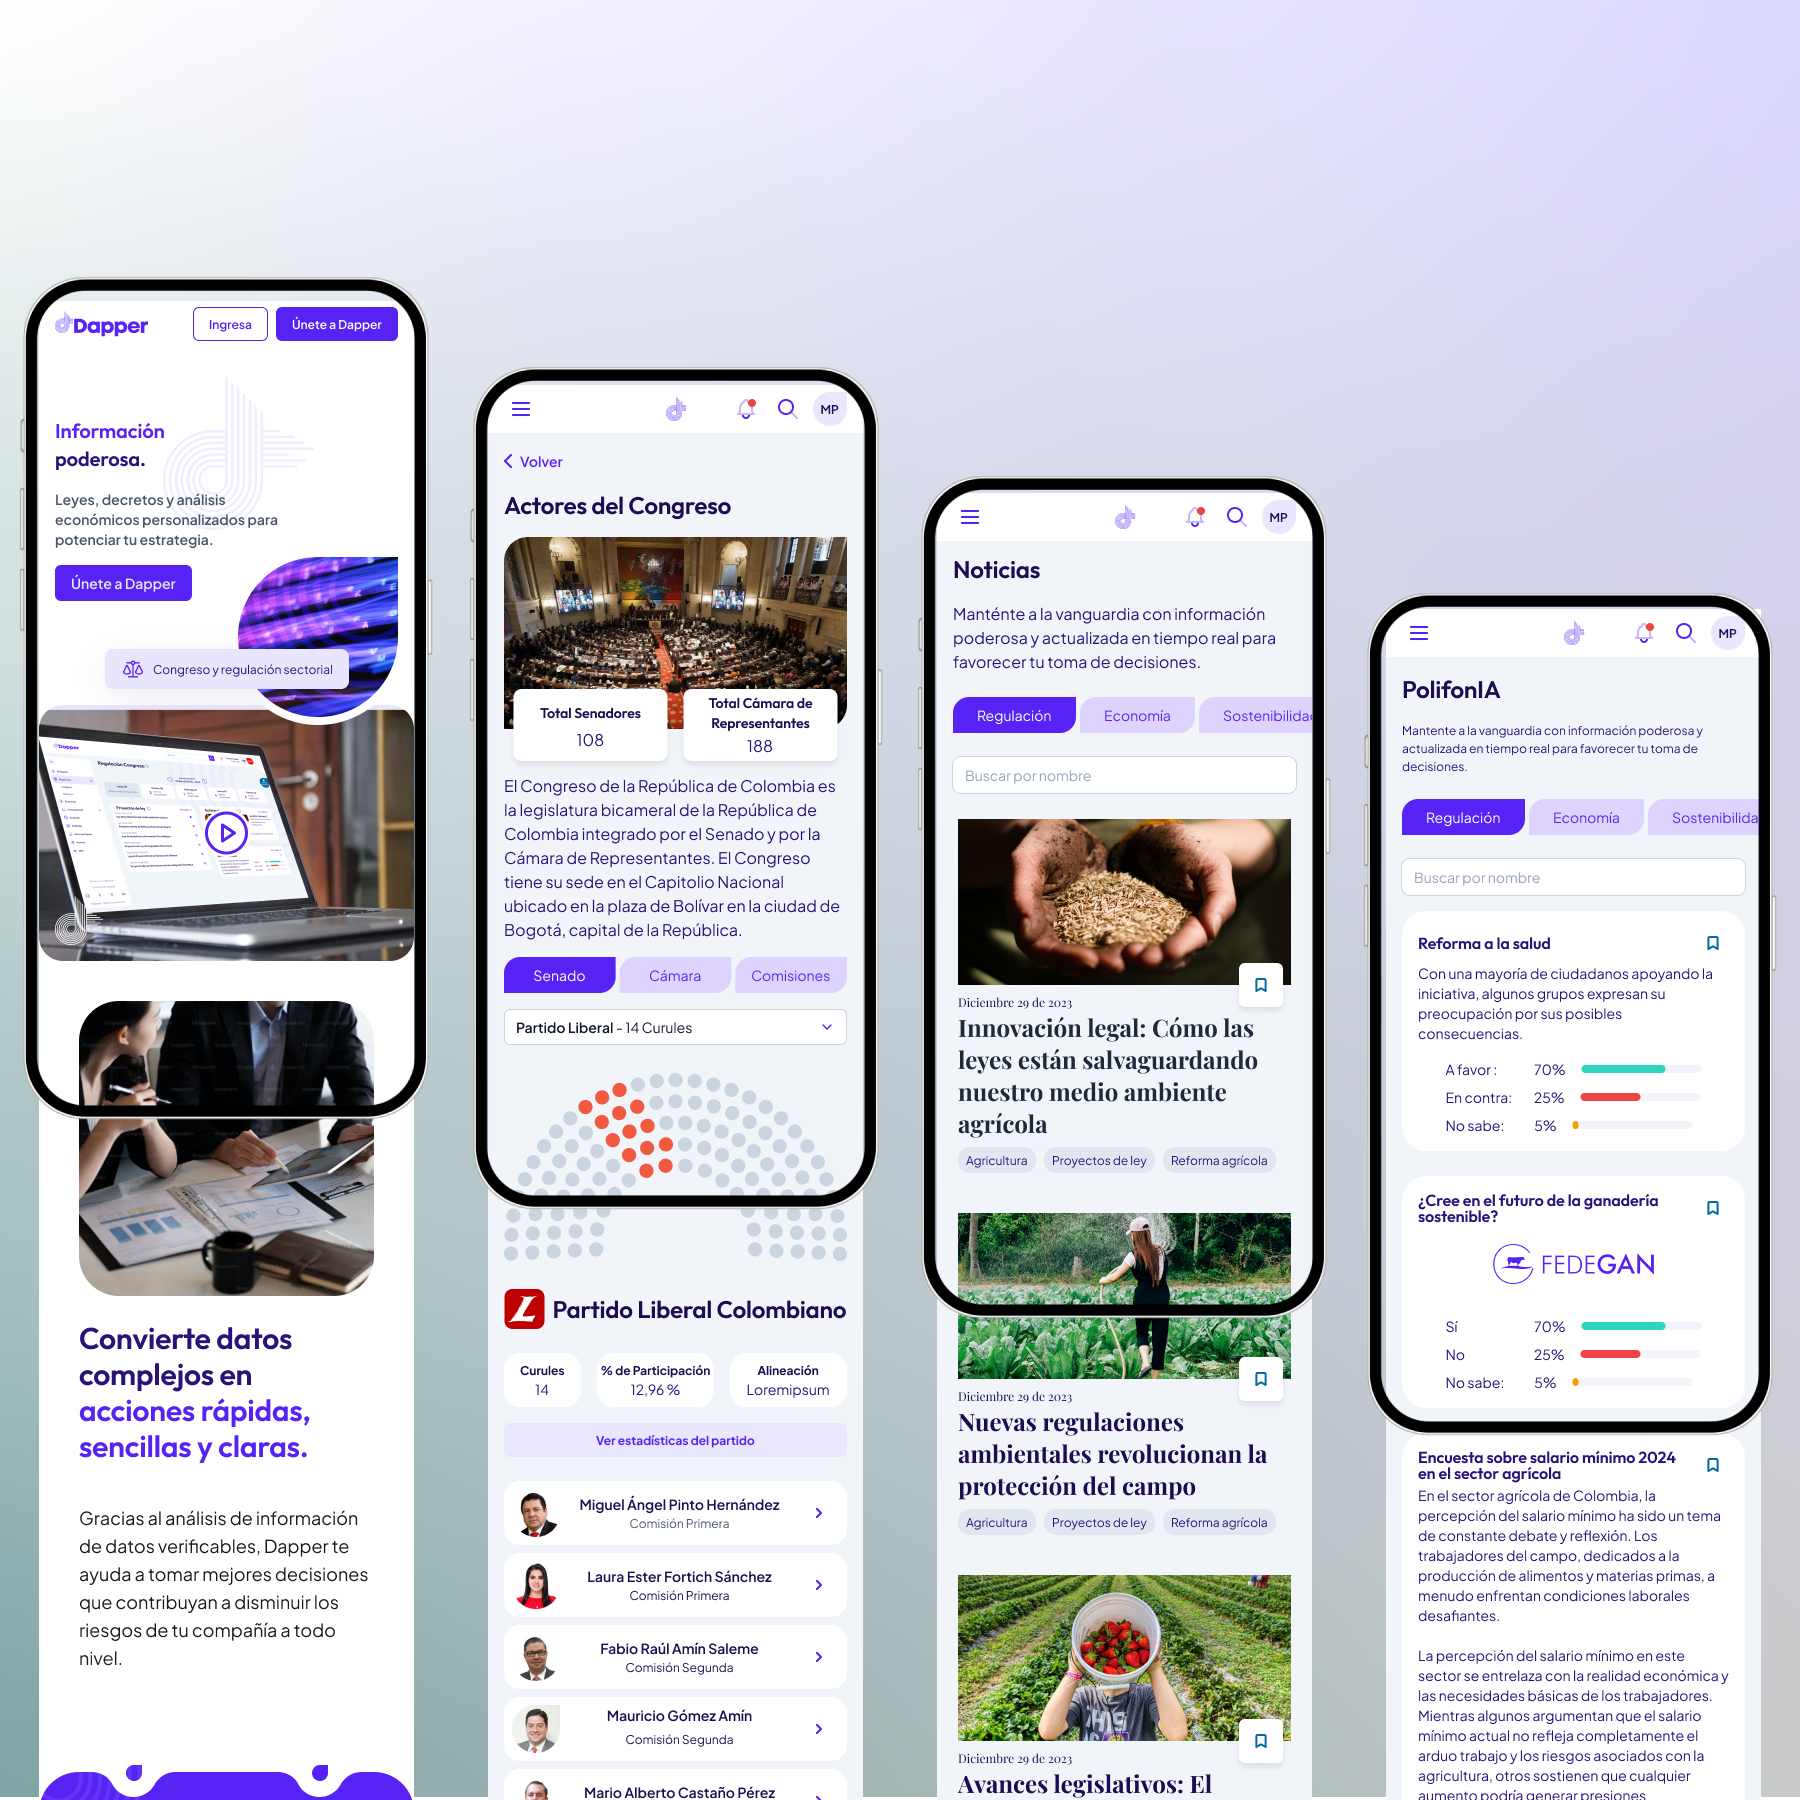
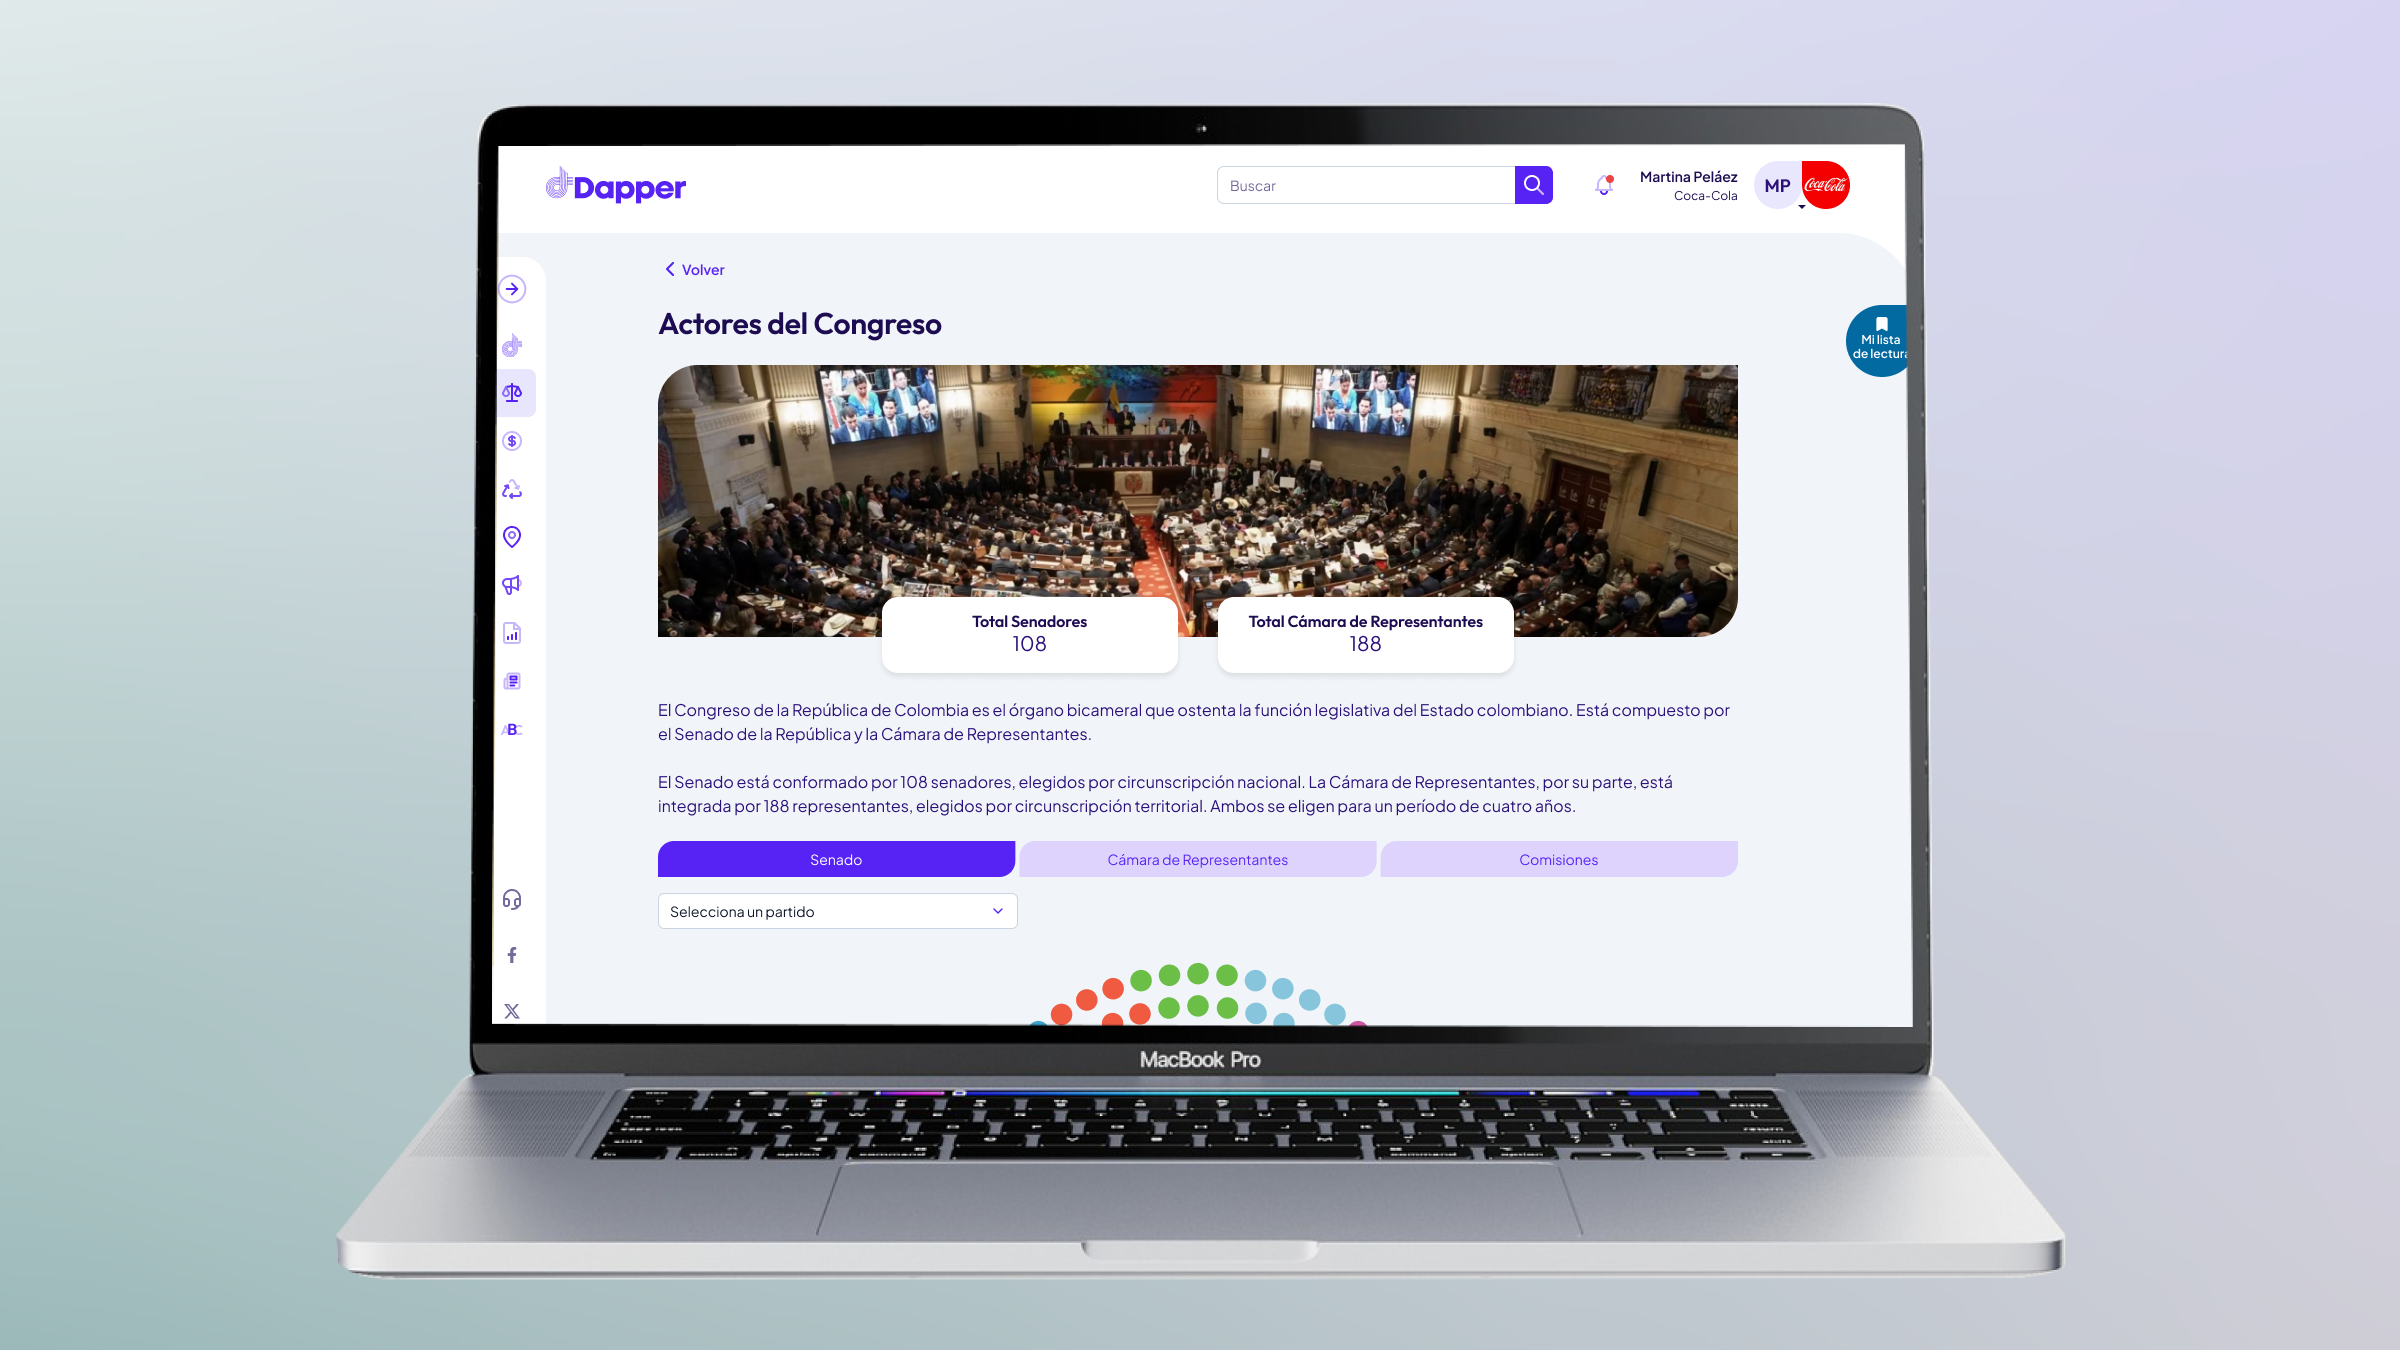
Dapper is a web platform that centralizes and simplifies access to legislative, regulatory, economic, and environmental data from the Colombian government.
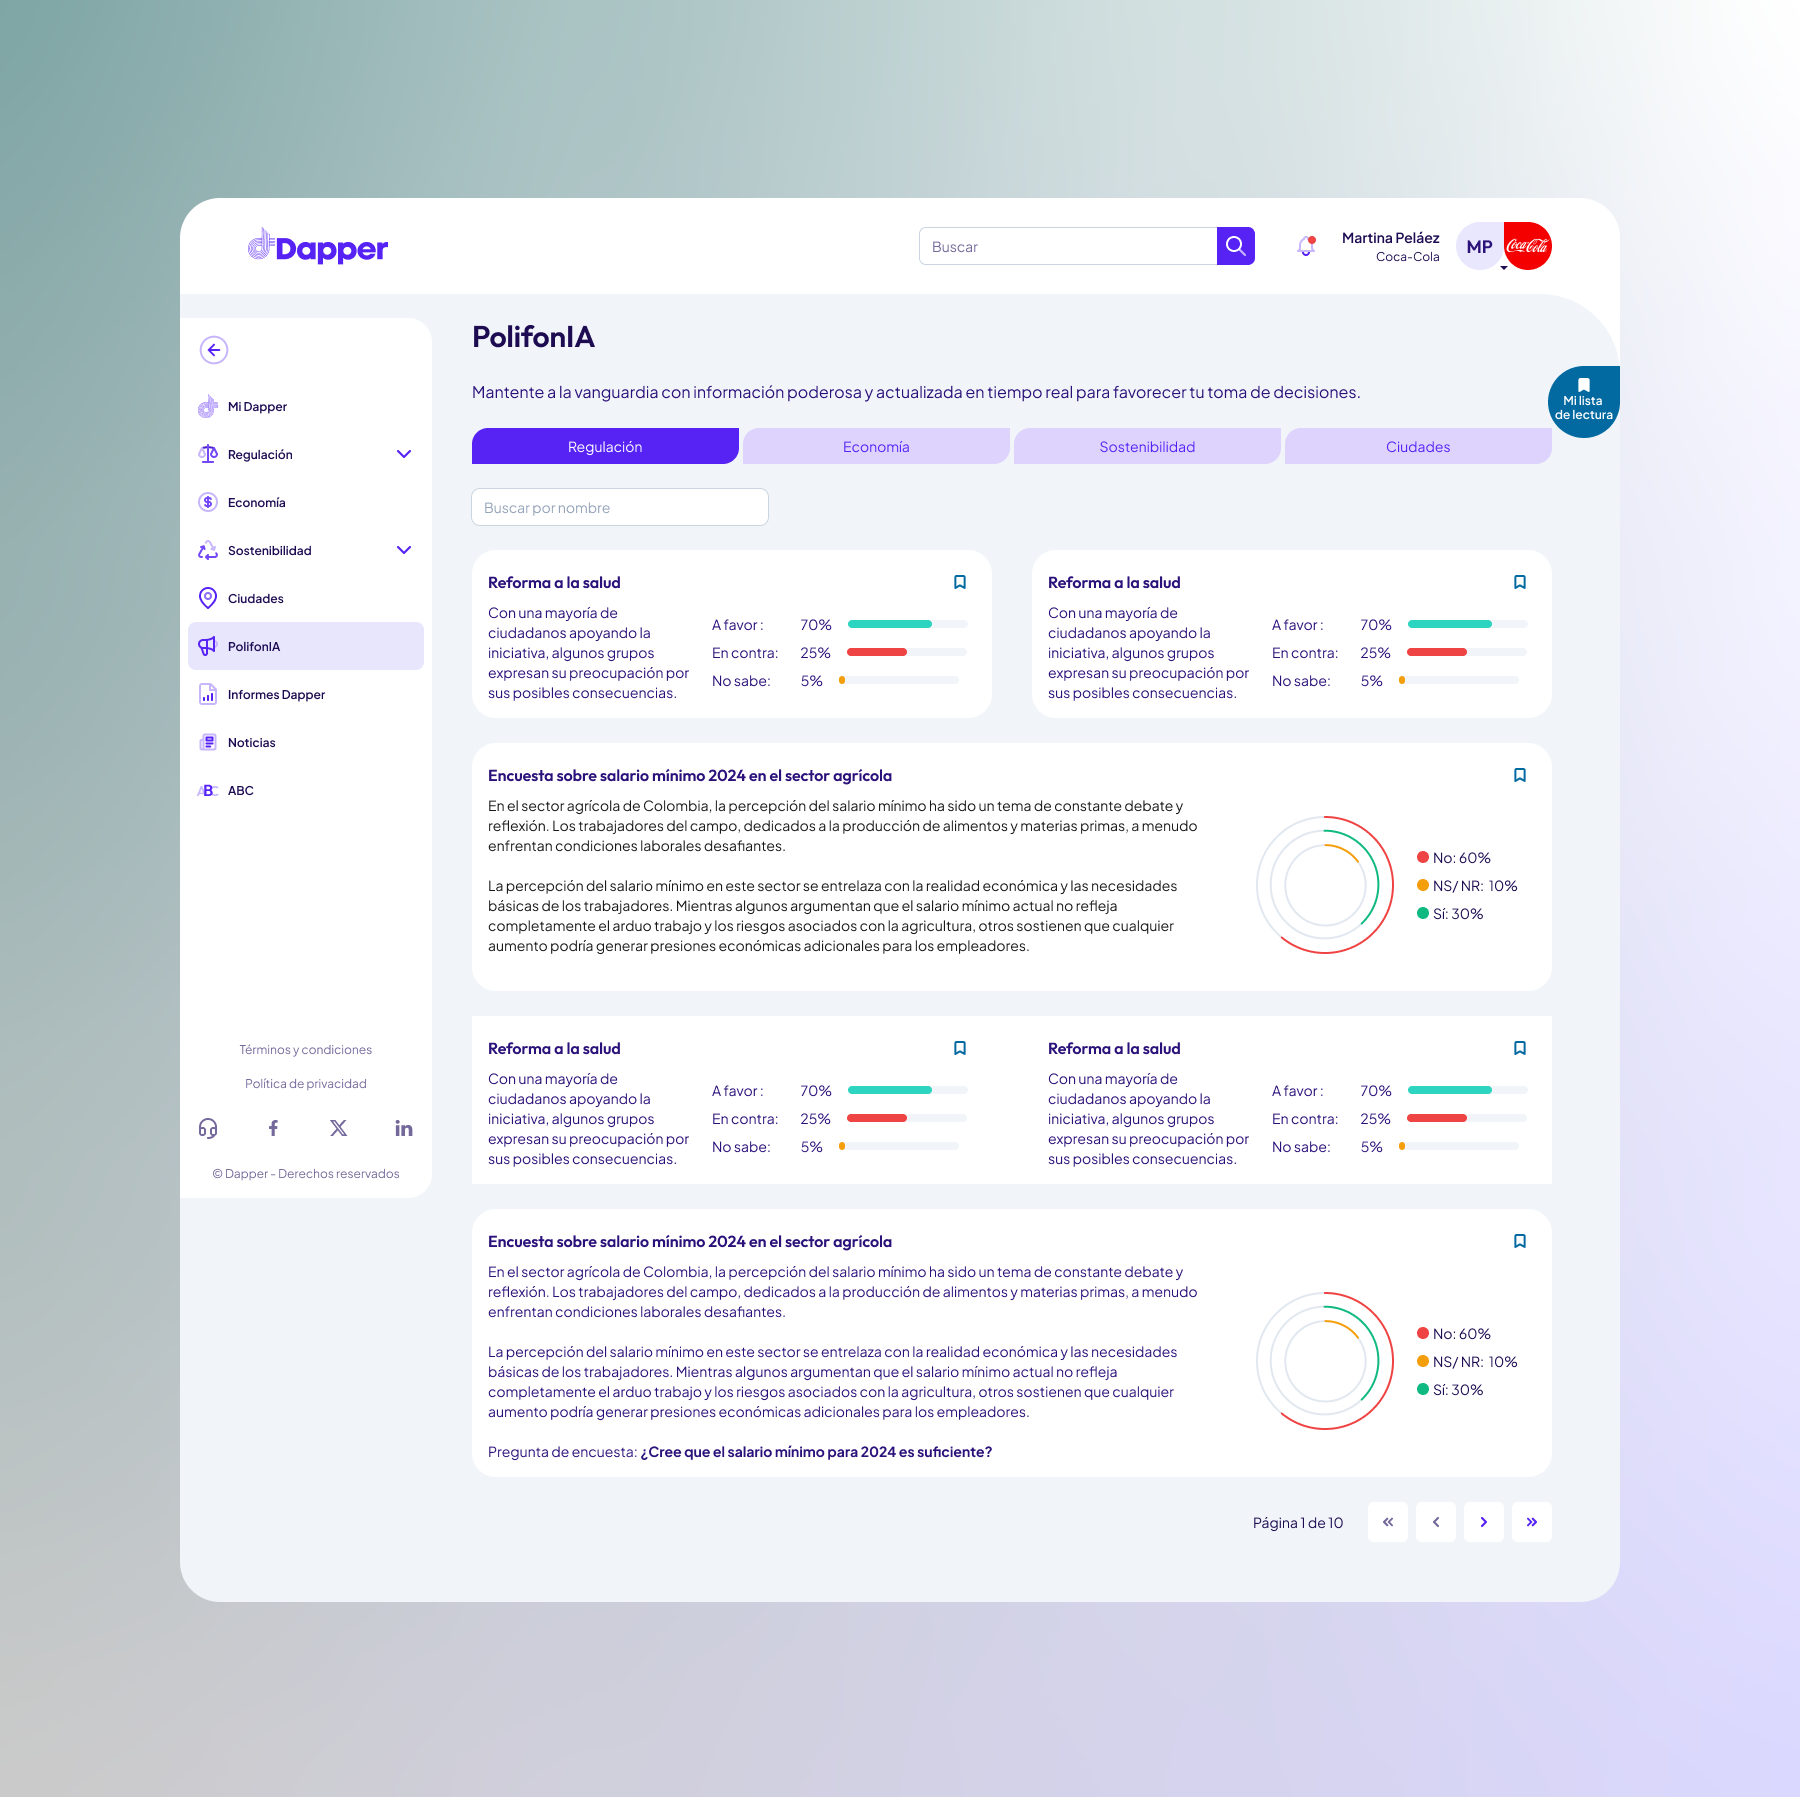
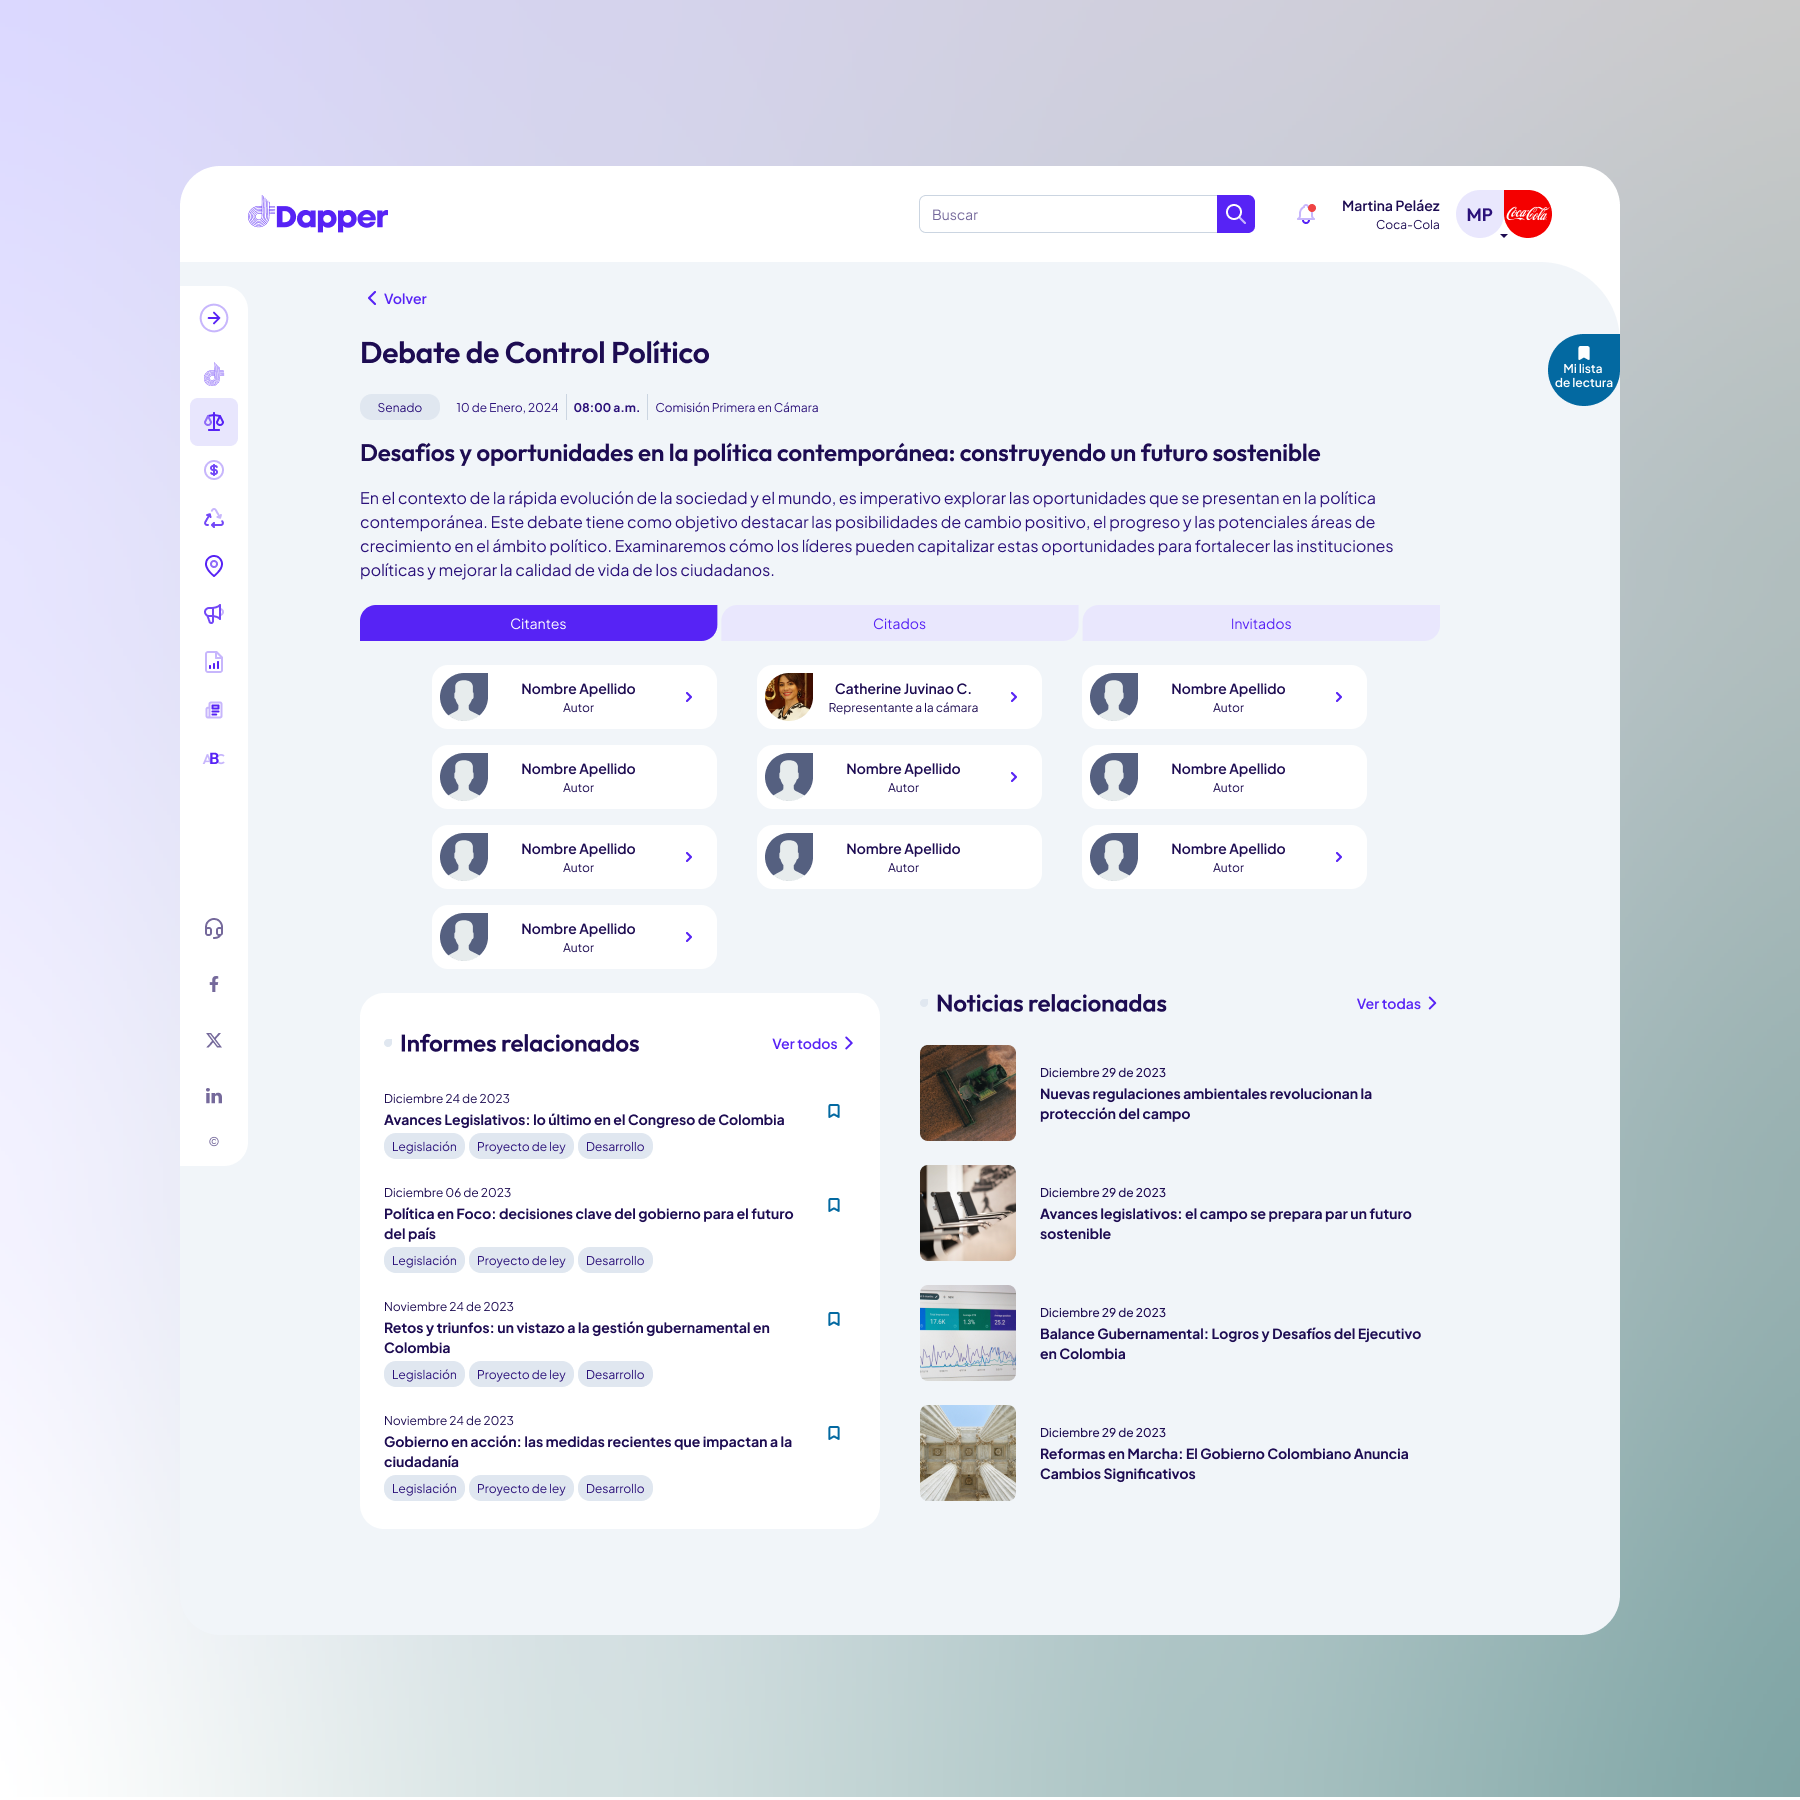
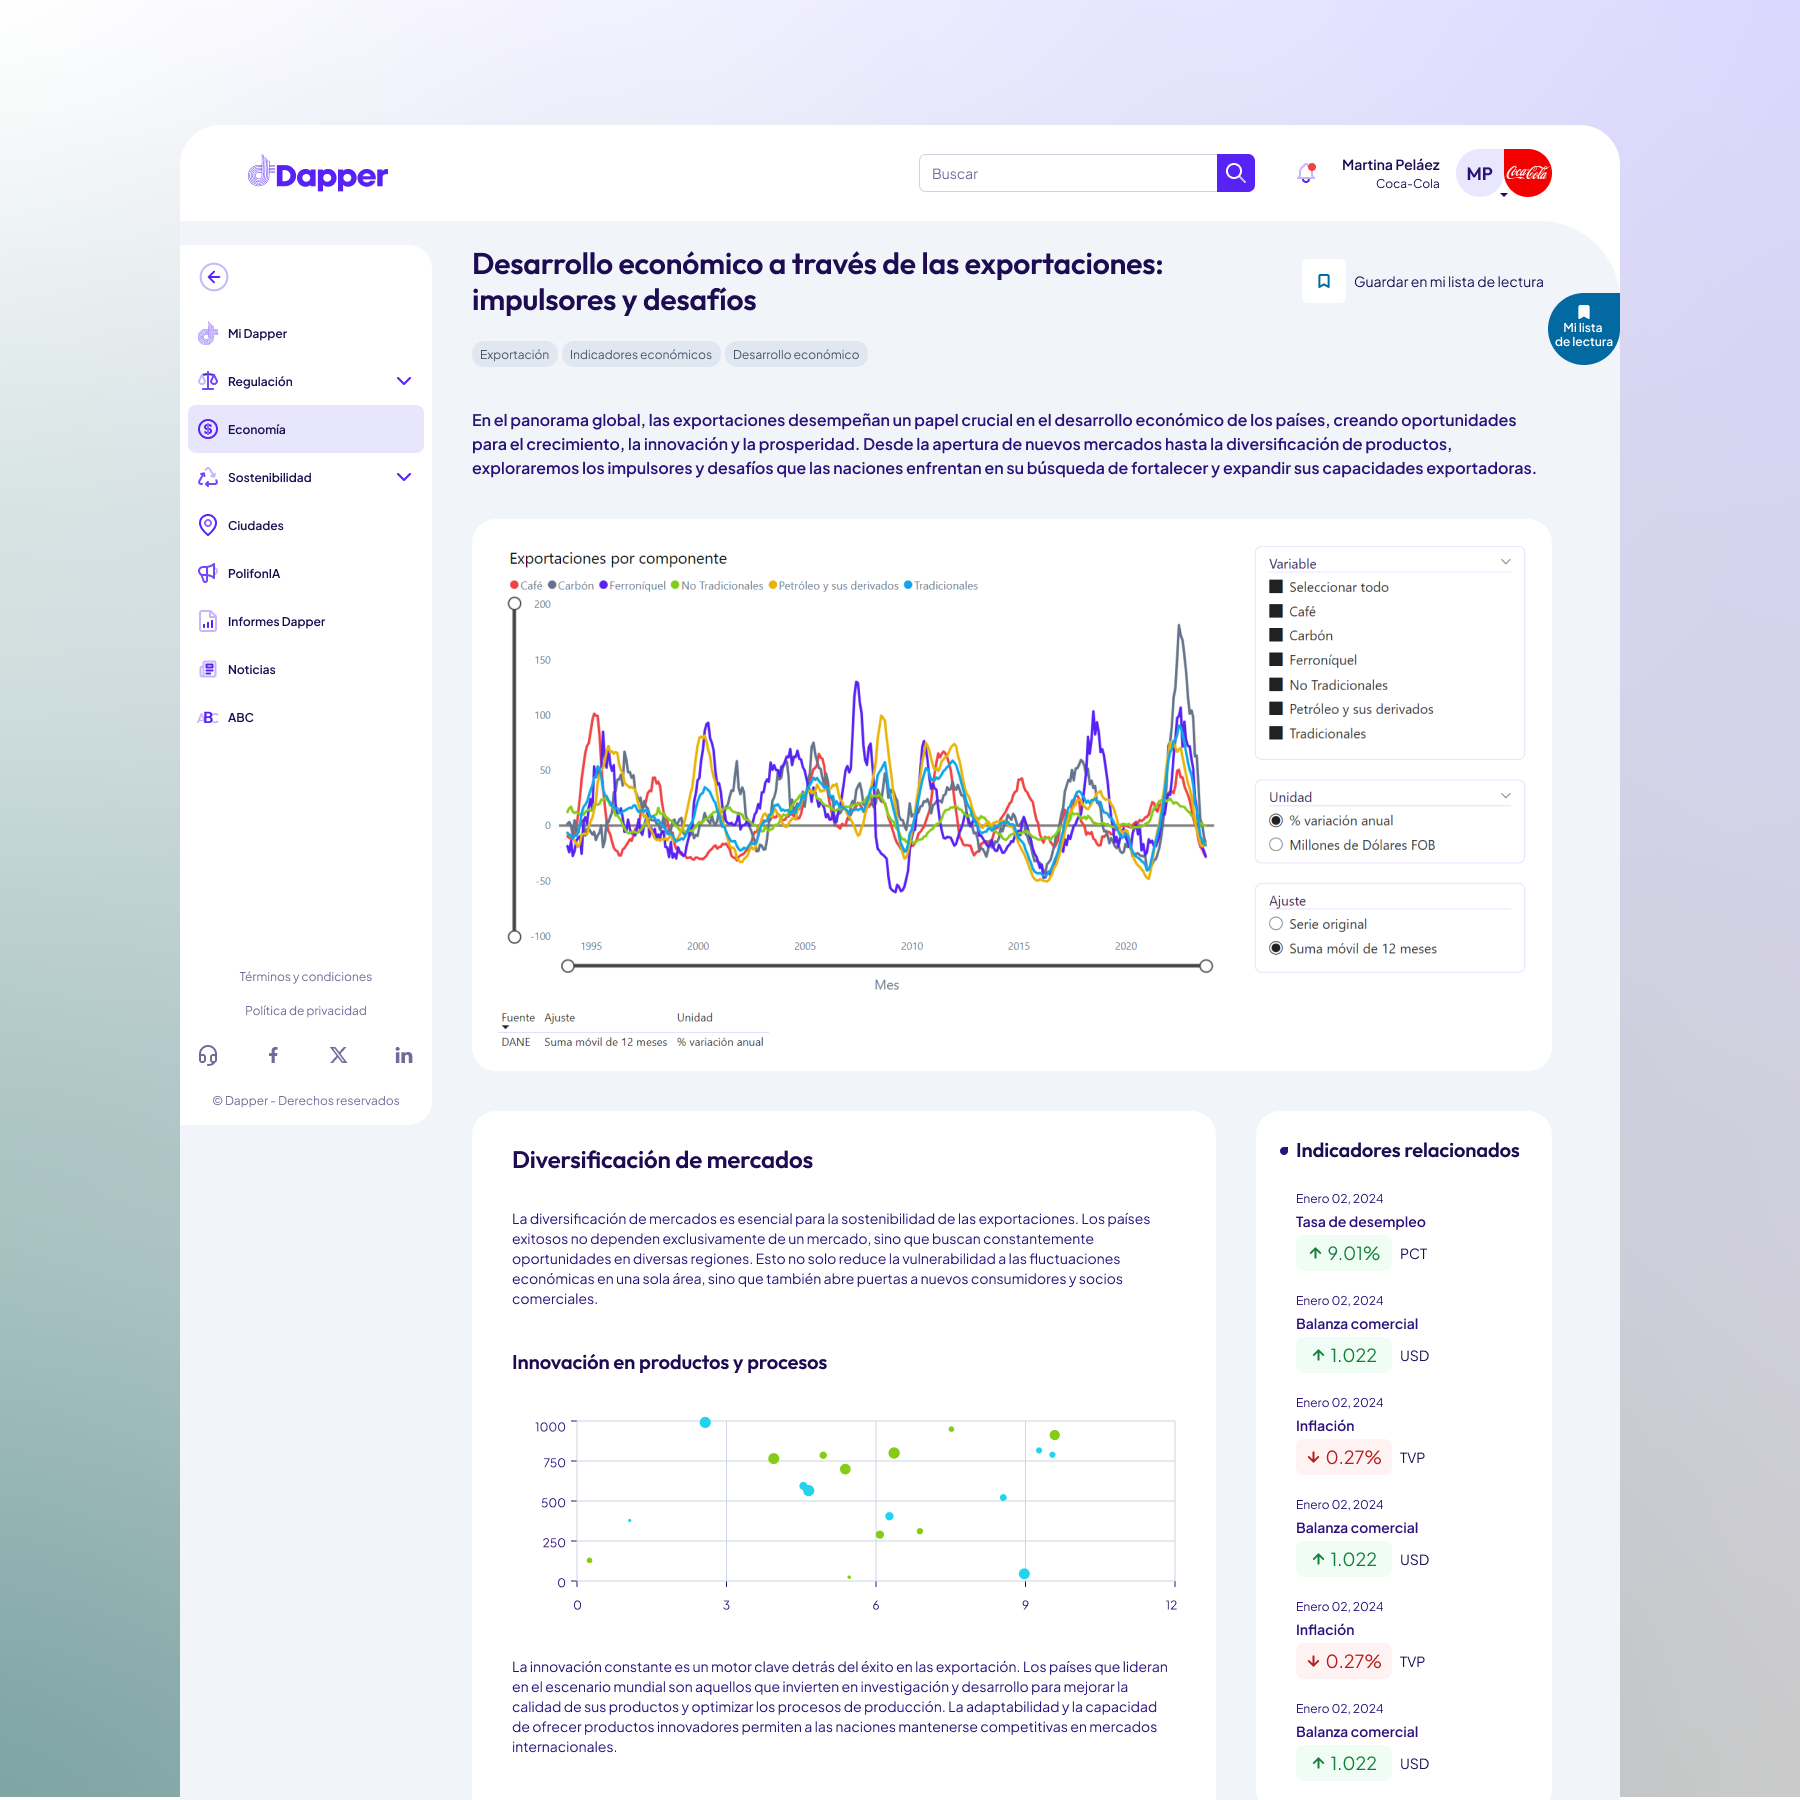
It is designed to help citizens, journalists, researchers, and public officials consult and analyze large volumes of information with ease.By consolidating complex data into an intuitive and accessible experience, Dapper promotes institutional transparency, encourages civic engagement, and supports evidence-based decision-making.
Impact
- +85% increase in average session duration, indicating higher engagement and smoother navigation.
- 62% reduction in time needed to locate specific information, due to improved user flows and architecture.
- Over 70% of users described the interface as “intuitive and trustworthy” compared to initial perceptions.
- 120% growth in new user and companies registrations within the first three months after launch.
- 45% of active users engaged with the AI-powered module, generating over 8,000 predictive queries.
- 40% improvement in task completion rates for key actions such as comparing legislation or downloading reports.
Design process
Empathize
- Workshops with journalists, public officials, researchers, and open data specialists.
- In-depth analysis of regulatory documentation and technical content.
- Interviews with potential users of the AI module to explore expectations and use cases.
Define
- Clear definition of functional and impact-driven objectives.
- Scope planning for both the platform redesign and the AI module integration.
- Sprint-based prioritization of critical and exploratory tasks.
Ideate
- Sitemap creation and user flows based on high-frequency tasks.
- Design of interaction points with the AI module, including natural language input and guided filters.
- Evaluation of strategies to present predictive data with clarity and confidence.
Prototype
- Visual inspiration moodboards.
- Low-fidelity wireframes (desktop and mobile) to validate key concepts.
- UI Kit with reusable design components and scalable interface patterns.
- High-fidelity prototypes incorporating conversational interfaces and visual data projections.
Test
- Usability testing with key stakeholders and AI target users.
- Iteration based on qualitative insights: clarity of predictions, user trust in results, and data comprehension.
- Final adjustments before handoff to development and AI engineering teams.
Tools & technologies
The UX/UI approach had to enable users with varying levels of digital literacy to explore massive amounts of information without getting lost in technicalities or rigid structures. The experience needed to be clear, efficient, and adaptable to real-world needs related to data consultation, exploration, and analysis.Additionally, a key innovation challenge was introduced: developing an artificial intelligence module capable of delivering predictive insights based on historical data, helping users anticipate trends and institutional behavior.